ft_linear_regression
Le code du projet
Les fonctions
import numpy as np
import csv
import matplotlib.pyplot as plt

def read_datas_to_array (file_name) :
	try :
		file = open(file_name, 'r')
	except Exception as exc:
		print("File error : {}".format(exc.__class__))
		exit(0)
	reader = csv.reader(file)
	datas = list(reader)
	del(datas[0])
	arr_datas = np.array(datas, dtype = 'i')
	return arr_datas

def normalize_minmax (value, arr_data) :
	return (value - arr_data.min()) / (arr_data.max() - arr_data.min())

def unnormalize_minmax (value, arr_data) :
	return value * (arr_data.max() - arr_data.min()) + arr_data.min()

def normalize_minmax_arr (arr_data):
	return (arr_data - arr_data.min()) / (arr_data.max() - arr_data.min())

def unnormalize_minmax_arr (arr_data, arr_normalized_data):
	return arr_normalized_data * (arr_data.max() - arr_data.min()) + arr_data.min()

def estimatePrice(mileage, theta0, theta1):
	return theta0 + (theta1 * mileage)

def cost_fct(arr_datas, theta0, theta1):
	arr_estimatedPrice = estimatePrice(arr_datas[:,0], theta0, theta1)
	arr_errors = (arr_estimatedPrice - arr_datas[:,1])**2
	result = arr_errors.mean()
	return result

def drv_cost_fct_theta0 (arr_datas, theta0, theta1):
	arr_estimatedPrice = estimatePrice(arr_datas[:,0], theta0, theta1)
	arr_errors = (arr_estimatedPrice - arr_datas[:,1])
	return arr_errors.mean()

def drv_cost_fct_theta1 (arr_datas, theta0, theta1):
	arr_estimatedPrice = estimatePrice(arr_datas[:,0], theta0, theta1)
	arr_errors = (arr_estimatedPrice - arr_datas[:,1]) * arr_datas[:,0]
	return arr_errors.mean()

def read_model_parameters():
	with open("model_parameters.txt", "r") as model_parameters_file :
		model_parameters_file = open("model_parameters.txt", "r")
		list_str_parameters = model_parameters_file.readlines()
	theta0 = float(list_str_parameters[0])
	theta1 = float(list_str_parameters[1])
	return {"theta0" : theta0, "theta1" : theta1}

def display_values(arr_mileage, arr_price, id_graph):
	fig = plt.figure(id_graph)
	plt.scatter(arr_mileage, arr_price, marker = 'P')
	fig.suptitle("Observations only")
	plt.grid()
	plt.show()
	plt.close()

def display_model(arr_mileage,  arr_estimated_price, id_graph):
	fig = plt.figure(id_graph)
	plt.plot(arr_mileage, arr_estimated_price, c = "green")
	fig.suptitle("Predictions only")
	plt.grid()
	plt.show()
	plt.close()

def display_values_and_model(arr_mileage, arr_price, arr_estimated_price, id_graph):
	fig = plt.figure(id_graph)
	plt.scatter(arr_mileage, arr_price, marker = 'P')
	plt.plot(arr_mileage, arr_estimated_price, c = "green")
	fig.suptitle("Observations and predictions")
	plt.grid()
	plt.show()
	plt.close()

def display_cost_fct(arr_normalized_datas):
    fig = plt.figure()
    # 3D Surface Plot
    ax1 = plt.axes(projection='3d')
    arr_theta0 = np.linspace(-2, 4, 100)
    arr_theta1 = np.linspace(-4, 2, 100)
    theta0_grid, theta1_grid = np.meshgrid(arr_theta0, arr_theta1)
    values = np.zeros_like(theta0_grid)
    for i in range(len(arr_theta0)):
        for j in range(len(arr_theta1)):
            values[i, j] = cost_fct(arr_normalized_datas, theta0_grid[i, j], theta1_grid[i, j])
    ax1.plot_surface(theta0_grid, theta1_grid, values, cmap="viridis", edgecolor="none")
    ax1.set_title("Cost Function Surface")
    ax1.set_xlabel("Theta0")
    ax1.set_ylabel("Theta1")
    ax1.set_zlabel("Cost")
    plt.show()
Le programme de prédiction
import sys
import libft_linear_regression as lr

args = sys.argv
if len(args) != 2 or int(args[-1]) < 0 or int(args[-1]) > 1000000:
	print("Arguments provided are inconsistents. Please enter a number between 0 and 1000000.")
	exit(0)

mileage = int(args[-1])

dict_params = lr.read_model_parameters()
theta0 = dict_params["theta0"]
theta1 = dict_params["theta1"]

estimated_price = theta0 + theta1 * mileage

estimated_price = 0 if estimated_price < 0 else estimated_price

print("The estimated price of the model for a mileage of {} is : {} ".format(mileage, estimated_price))
Le programme d’entraînement
import sys
import numpy as np

from libft_linear_regression import *

args = sys.argv
if len(args) != 3 :
	print("Please enter valid args : python3 ft_linear_regression.py [file name].csv [flag bonus 0 or 1]")
	exit(0)

file_name = args[1]
flag = int(args[-1])

arr_datas = read_datas_to_array(file_name)

theta0 = 0
theta1 = 0
learningRate = 0.01
limit = 30000

print("Initial values :\ntheta0 = {}\ntheta1 = {}\nlearningRate = {}\ntraining_iterations = {}".format(
	theta0,
	theta1,
	learningRate,
	limit
))

# Min Max Normalization
arr_mileage_normalized = normalize_minmax_arr(arr_datas[:,0]).reshape((len(arr_datas[:,0])),1)
arr_price_normalized = normalize_minmax_arr(arr_datas[:,1]).reshape((len(arr_datas[:,1]),1))
arr_normalized_datas = np.concatenate([arr_mileage_normalized,arr_price_normalized], axis = 1)

count = 0
while (count < limit) :
	if flag == 1 and count % 10 == 0:
		cost = cost_fct(arr_normalized_datas, theta0,theta1)
		print(count, " | Fonction de cout : ", cost)
	tmp_theta0 = theta0 - learningRate * drv_cost_fct_theta0 (arr_normalized_datas, theta0,theta1)
	tmp_theta1 = theta1 - learningRate * drv_cost_fct_theta1 (arr_normalized_datas , theta0, theta1)
	theta0 = tmp_theta0
	theta1 = tmp_theta1
	count+=1

print("\nLinear regression : OK")
print("Normalized theta0 = {}\nNormalized theta1 = {}".format(theta0, theta1))

arr_estimated_price = estimatePrice(arr_normalized_datas[:,0], theta0, theta1)
arr_estimated_price_unormalized = unnormalize_minmax_arr(arr_datas[:,1] ,arr_estimated_price)

estimated_norm_price_max = estimatePrice(1, theta0, theta1)
estimated_norm_price_min = estimatePrice(0, theta0, theta1)

final_theta1 = (unnormalize_minmax(estimated_norm_price_max, arr_datas[:,1]) - unnormalize_minmax(estimated_norm_price_min, arr_datas[:,1])) / (arr_datas[:,0].max() - arr_datas[:,0].min())
final_theta0 = unnormalize_minmax(estimated_norm_price_min, arr_datas[:,1]) - final_theta1 * arr_datas[:,0].min()

with open("model_parameters.txt", 'w') as model_parameters_file :
	model_parameters_file.writelines([str(final_theta0), "\n", str(final_theta1)])

print("theta0 = ", final_theta0)
print("theta1 = ", final_theta1)

if flag == 1 :
	print("Fonction de coût = ", cost)
	display_values(arr_datas[:,0], arr_datas[:,1], 2)
	display_model(arr_datas[:,0], arr_estimated_price_unormalized,3)
	display_values_and_model(arr_mileage_normalized, arr_price_normalized, arr_estimated_price, 1)
	display_values_and_model(arr_datas[:,0], arr_datas[:,1], arr_estimated_price_unormalized, 4)
	display_cost_fct(arr_normalized_datas)
Les résultats
Quelques exemples de résultats de la fonction de coût avec différents learningRate et différents nombre d’itération
| learningRate | nbr d’itérations | Valeur de la fonction de coût |
|---|---|---|
| 0.1 | 1300 | 0.020699401199204836 |
| 0.01 | 13000 | 0.0206993886698352 |
| 0.001 | 130000 | 0.020699387460695752 |
Les valeurs optimales des paramètres obtenus par le modèle sont :
- theta0 = 8499.598743566039
- theta1 = -0.021448954971897145
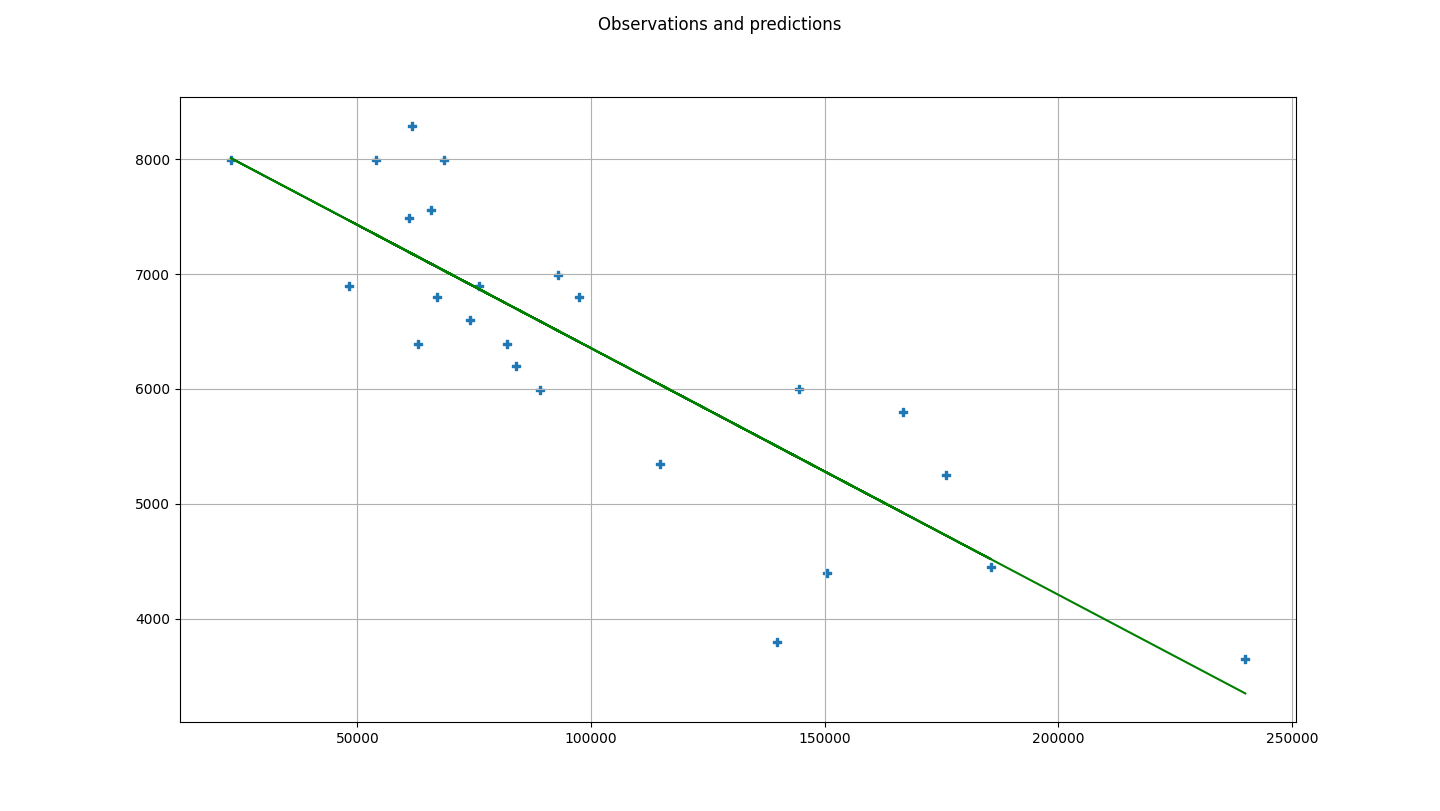
Représentation graphique